TradingView is a popular charting platform that offers charts for both traditional financial markets as well as crypto markets. Keep reading to discover everything you need to know about TradingView.
What is TradingView?
TradingView is a financial platform for traders and investors. Like other charting platforms and analysis tools, TradingView wants to provide traders with the information they need to make informed trades. With that goal in mind, TradingView offers charts, trade ideas, advanced technical analysis tools, real-time quotes, and more.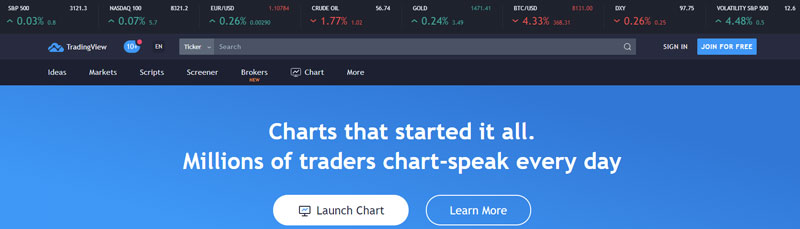
The key feature of TradingView is that you can draw virtually anything on the platform’s charts – from simple moving averages to advanced technical analysis bands.
TradingView was also one of the first major charting platforms to integrate bitcoin. When first launched in 2011, TradingView published data and charts for traditional financial markets. Since June 2013, however, TradingView has supported bitcoin charting. The company initially used Mt. Gox for its crypto exchange data.
Today, TradingView offers a wide range of charting tools for retail and institutional investors alike. The platform aims to be an all-in-one gateway into the world of stock investing, global trading, and market analysis.
After setting up TradingView’s charting tools, you can start dabbling in paper trading directly through the platform. Test your strategies against various market conditions before you place real money on the line.
Then, once you’re ready to make real orders through TradingView, you can open a brokerage account with one of several supported brokers, deposit money into those brokerage accounts, and connect the account to TradingView.
However, TradingView only supports a small number of stock brokerages and cryptocurrency exchanges. Most traders keep TradingView separate from their brokerage. You can easily use TradingView without ever connecting a brokerage account.
The basic version of TradingView is free, with subscription plans ranging from $15 to $60 per month.
Contents
TradingView Features
Key features of TradingView include all of the following:
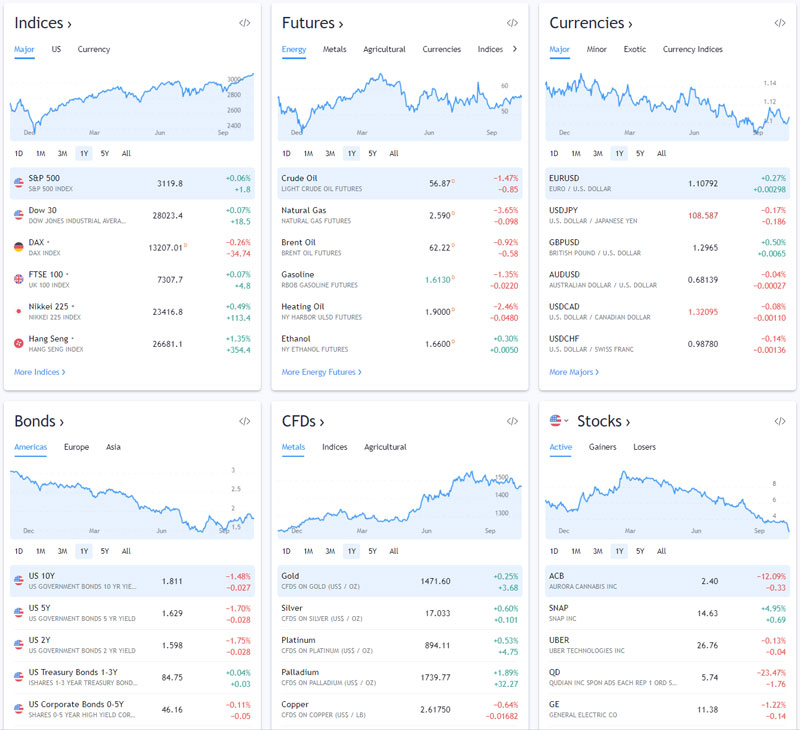
Track Variety of Financial Instruments and Markets: TradingView lets you track multiple markets and financial products from one convenient platform, including cryptocurrencies (like CoinMarketCap, CryptoCompare and CoinGecko), fiat currencies, stocks, indices, futures, bonds, and CFDs.
Track Multiple Subcategories: Within each category, TradingView lists multiple subcategories. You can view individual cryptocurrency markets for BCH, BTC, ETH, XRP, and other major currencies, for example. You can view subcategories for fiat currencies like ‘minor’, ‘major’, ‘exotic’, and ‘Europe’.
Target Specific Types of Stocks: TradingView makes it easy to check stocks and market movements through its platform. However, TradingView also has subcategories of stocks within its platform, including ‘top gainers’, ‘large-cap’, ‘top losers’, ‘most active’, and ‘most volatile’, among other categories.
Free and Paid Options: TradingView has four different subscription levels available ranging from free to $60 per month.
Multiple Indices: TradingView makes it easy to track a variety of indices, including currency indices, S&P sectors, US indices, and major world indices.
Futures Markets: TradingView supports futures markets across multiple categories, including agricultural, energy, currencies, metals, world indices, and interest rates.
Bonds: Bond categories include ‘major 10Y’, ‘Americas’, ‘Europe’, ‘Asia’, ‘Pacific’, ‘Middle East’, and ‘Africa’.
CFDs: The Contracts for Difference (CFDs) category includes subcategories like agricultural, energy, metals, world indices, and bond and interest rates.
Works on Any Browser: TradingView works on any browser without the installation of any additional software.
HTML5: The reason TradingView works on any modern browser is that it’s all coded in HTML5.
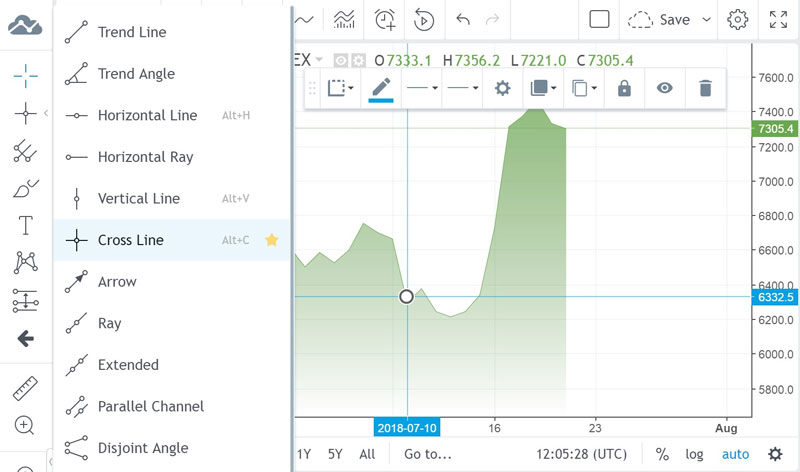
50+ Intelligent Drawing Tools: Advanced traders can take advantage of TradingView’s advanced drawing tools, letting you draw virtually anything on charts.
Multiple Chart Types: TradingView has all types of chart types and layouts, including Renko, Kagi, line break, P&F charts, and more.
Free Trials: All four TradingView subscription packages have 30-day free trials.
Server Side Alerts: TradingView can be customized to send alerts for certain notifications. You can get a notification when the market meets your custom-set criteria. You can tell TradingView to send you an alert if Microsoft stock drops outside the Bollinger Bands channel, for example, or if BTC drops below $7,000. There are 12 different alert conditions that can be applied to indicators or drawing tools.
Screener Tools: TradingView has stock and crypto screeners. These screeners are search tools that let you filter assets based on specific criteria. You can find the cheapest companies that make the most money by filtering by the lowest P/E ratio, for example. Over 100+ fields are available through the screeners.
50+ Exchanges and Data Feeds: TradingView is connected to 50+ exchanges and data feeds. The platform has a professional commercial data feed that gives it direct access to stocks, futures, all major indices, and CFDs. That means TradingView users get premium data on prices, volume, and history streamed directly from the United States and international markets.
Mobile Apps: TradingView has mobile apps for iOS and Android. The apps let you stream real-time quotes on the go, respond to other TradingView users, and access saved charts anywhere.
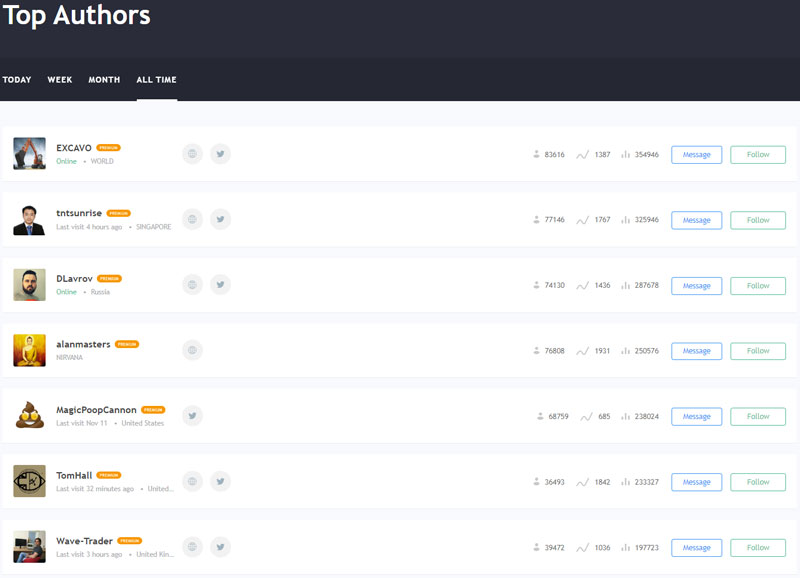
Social Network: TradingView is one of the more socially oriented charting tools available today. You can communicate with other users, share trading strategies, and participate in TradingView’s forums. There are over 8 TradingView users. Some users are followed by hundreds of other traders. You can follow someone to get their opinions on recent market movements, for example. Some traders even offer day trading courses or education programs through trading chat rooms.
Customized Technical Analysis: TradingView has 100+ pre-built studies for detailed market analysis. These studies cover the most popular trading concepts and indicators.
Pine Programming Language: The team behind TradingView built the Pine programming language, which allows you to create and share custom studies and signals. Any study’s code can be easily modified, and nearly any custom indicator can be created from scratch using this code.
Paper Trading: TradingView has a full-featured paper trading system that lets you buy and sell assets for virtual money. You can test trading strategies in various market conditions before investing any real money.
Customizable Chart Options: TradingView lets you customize charts with dozens of different options. You can add basic things like volume and price to charts, for example. You can also add more advanced features like Bollinger Bands, Donchian Channels bands, and Ichimoku Lead (9, 26, 52, 26).
Multi-Broker Support: TradingView lets you place a real order at any time directly through the platform by opening an account with supported brokers. Just deposit money into that brokerage account, connect the account to TradingView, then start trading.
How to Use TradingView
TradingView was created with the goal of being easy and intuitive for beginners to use, but also powerful enough for advanced chartists to master.
Basically, TradingView gives you a wide range of charting tools. Then, you use those charting tools to make informed trades. You get real-time data and browser-based charts that let you do your research from anywhere like finding out the price of bitcoin or any of the major markets around the world.
All TradingView data is accessible from directly within any modern internet browser. There’s no need to install any software (although mobile apps for iOS and Android are available).
Once you’ve signed up for TradingView, you can begin browsing through multiple markets, including stocks, indices, cryptocurrencies, futures, bonds, fiat currencies, and CFDs.
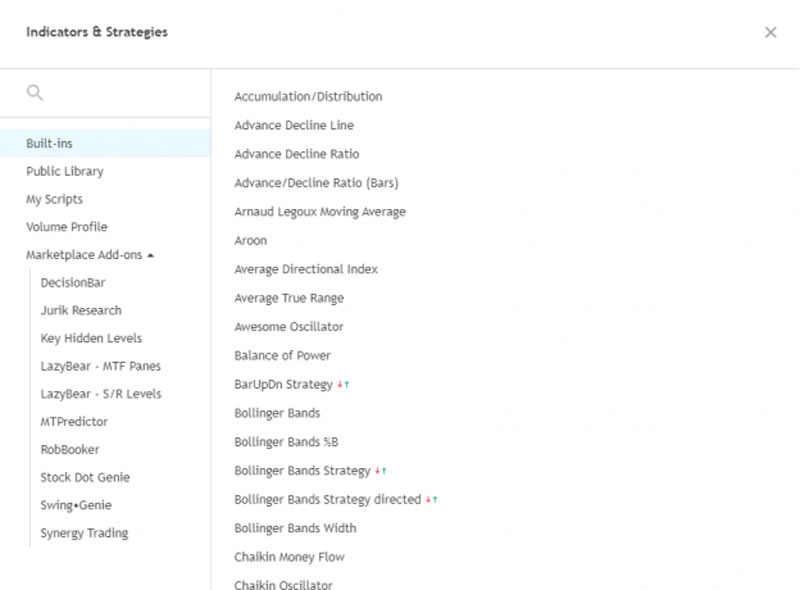
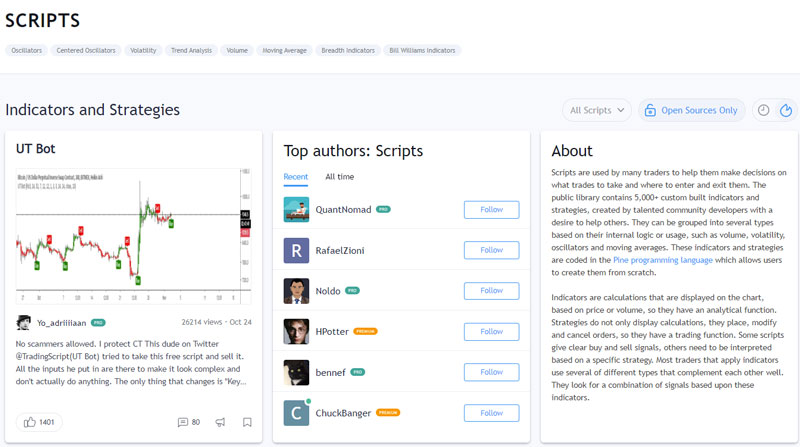
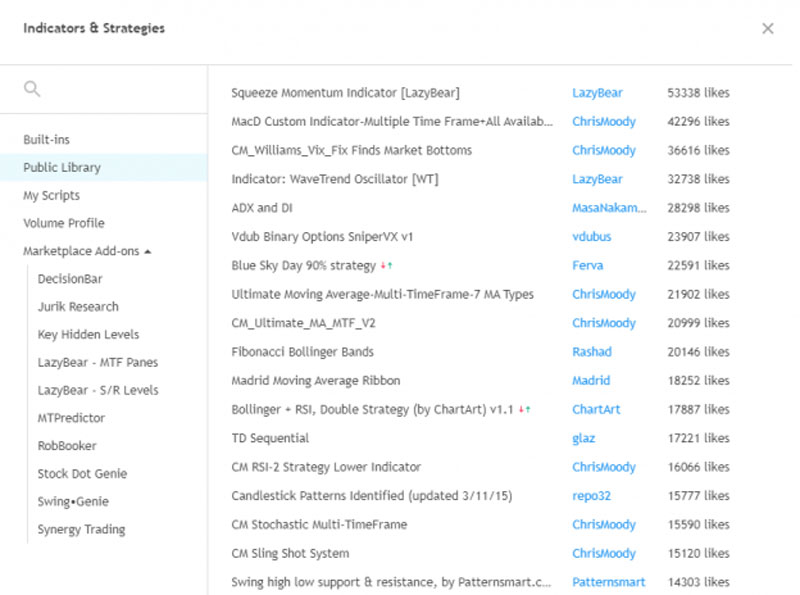
You can also browse through scripts or implement scripts into your own charts. TradingView separates scripts into subcategories like oscillators, centered oscillators, volatility, trend analysis, volume, moving average, and Bill Williams indicators.
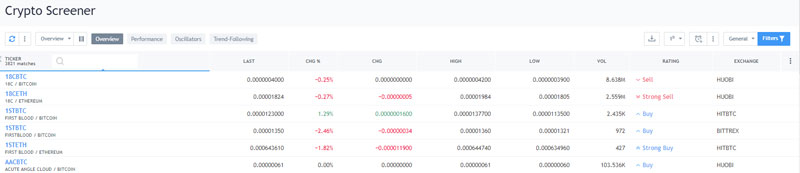
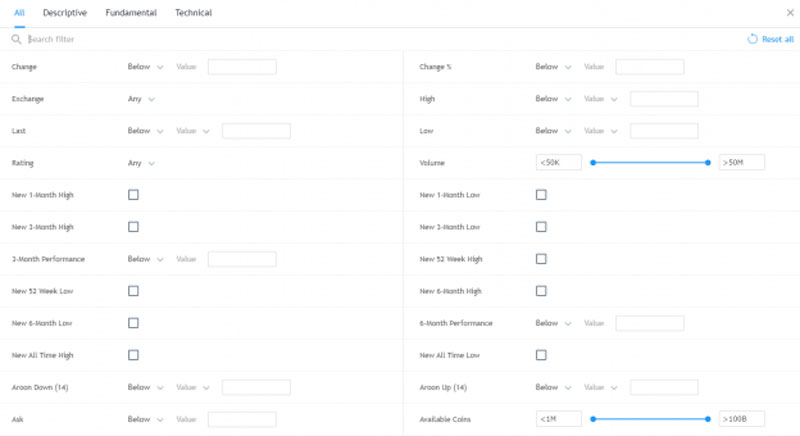
You will also want to use the screener to find the right asset. TradingView has a stock screener, a forex screener, and a crypto screener.
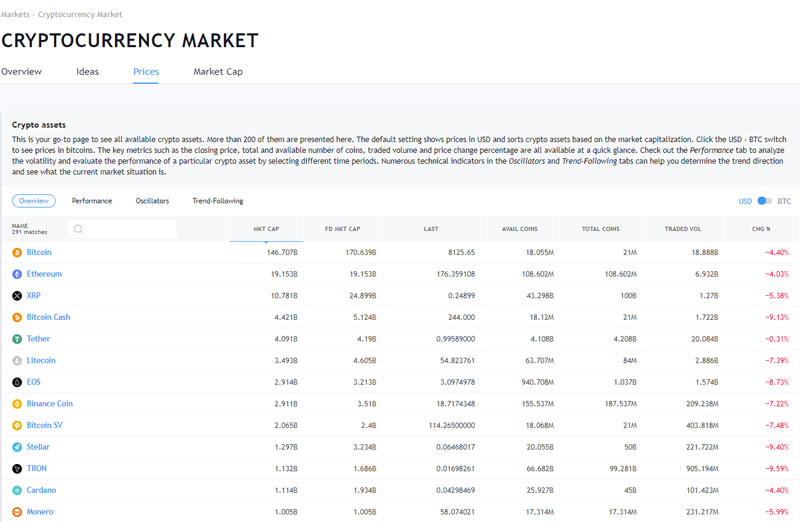
You can use the crypto screener, for example, to view thousands of different cryptocurrencies, then narrow down the list based on specific filters. TradingView has a wide range of filters, including descriptive, fundamental, and technical filters. You can filter digital tokens based on a descriptive subfilter like volume and price, a fundamental subfilter like total coins and traded coins, or a technical subfilter like a new 52-week high.
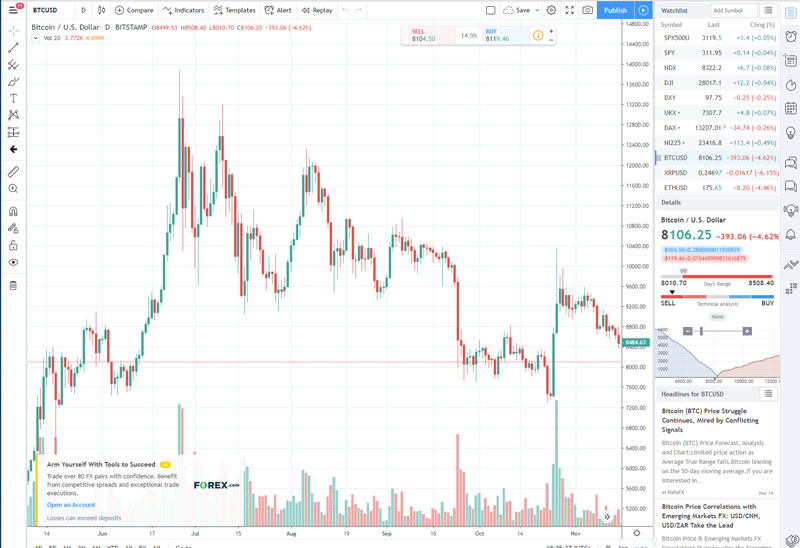
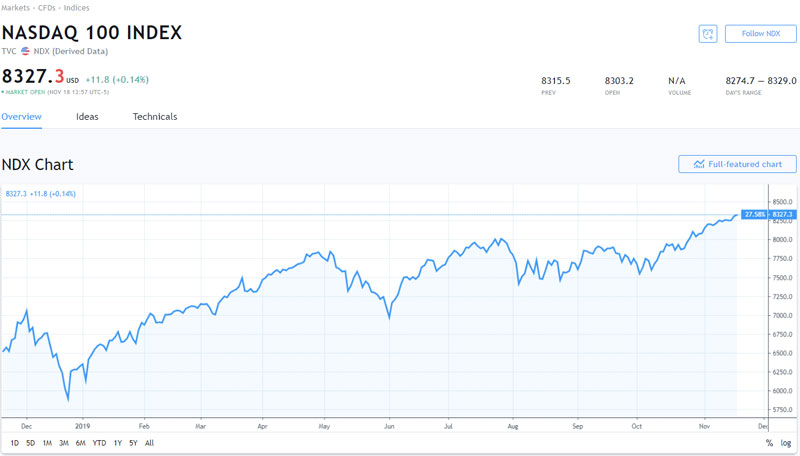
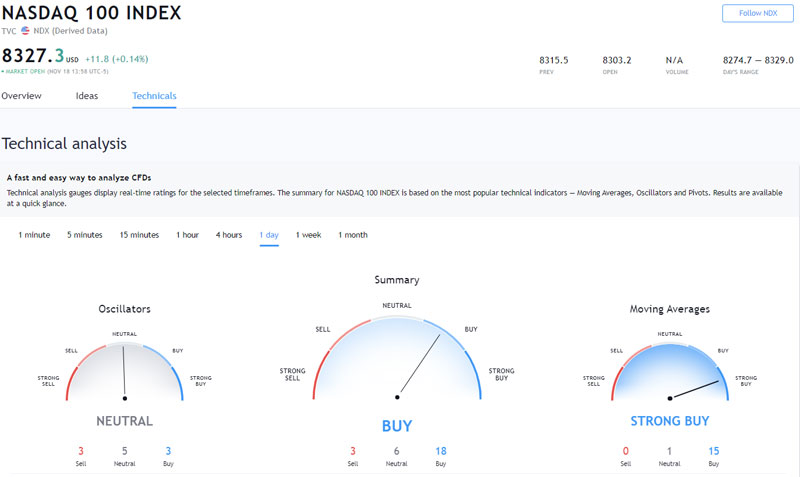
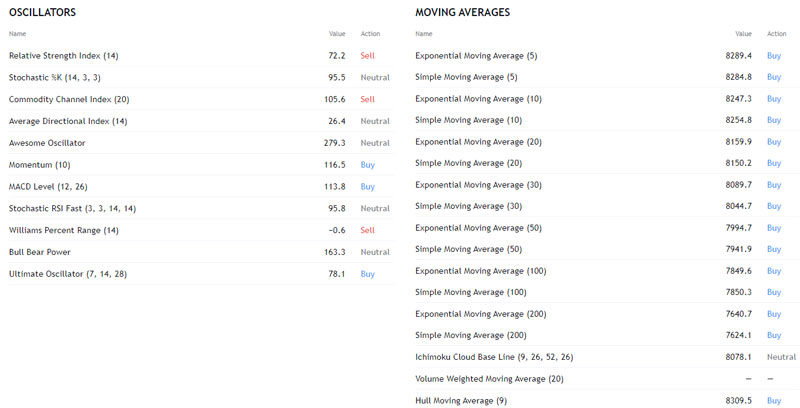
No matter what market you’re looking at with TradingView, you can view a wide range of indicators for that market. you can view the percentage change over a specified period of time, including the 1 week, 1 month, 3 months, 6 months, YTD, and 1-year performance. You can add (literally) dozens of other indicators to each chart, including basic things like the bid to more advanced criteria like the awesome oscillator, Donchian Channels bands, and Ichimoku Lead (9, 26, 52, 26).
Ultimately, whether you want to perform advanced technical analysis on markets or you want to just look at basic factors like price and volume, TradingView makes it easy to customize charts based on your trading needs.
Meanwhile, if you want to directly make trades through TradingView, then you can do that too. You can connect a small number of brokerage accounts to your TradingView account, then make trades directly through TradingView.
Currently, TradingView supports about 20 different brokers, including:
Futures Brokers: WH-Selfinvest, AMP Global Clearing, Advantage Futures, Dorman Trading, Global, Mirus, Phillip Capital, RJO’Brien, Rosenthal Collins Group LLC, Robbins Trading, Straits Financial, Tradovate, Wedbush, and Modalmais.
Stocks Brokers: Modalmais and Alor.
Forex Brokers: OANDA, FOREX.com, and DirectFX.
You can integrate a broker with the TradingView platform directly, although most users will just keep their TradingView charts separate from their brokerage platform.
How Does TradingView Work?
TradingView gets its data from multiple exchanges and sources worldwide. The company pays for a commercial-grade data stream, then shares that data with users in the form of charts.
TradingView also makes it easy for brokerages to connect to TradingView. The broker builds a REST Web API on its own servers based on TradingView’s specifications. Then, the broker’s platform is integrated with TradingView. All integration takes place over the internet thanks to TradingView’s HTML5 infrastructure.
All of this takes place behind the scenes with TradingView. The primary way you will interact with TradingView will be in the form of charts and graphs.
TradingView Pricing
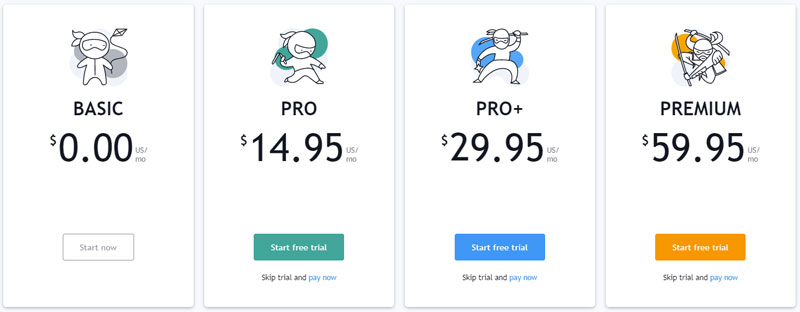
TradingView offers four different subscription levels.
Basic (Free)
- 1 chart per tab
- 1 device at the same time
- 1 saved chart layout
- Day, week month bar replay
- 12 customizable chart types
- 50+ smart drawing tools
- Compare symbols
- 100+ pre-built indicators, 8,000 community-powered indicators
- 3 indicators per chart
- 1 server-side alert on price, indicators, or drawings
- Advertisement-supported
- No customer support
Pro ($12.95 Per Month Paid Annually / $14.95 Per Month Paid Monthly)
- 2 charts per tab
- 1 device at the same time
- 5 saved chart layouts
- Custom time intervals and range bars
- 12 customizable chart types
- 50+ smart drawing tools
- Compare symbols
- 100+ pre-built indicators, 8,000 community-powered indicators
- 5 indicators per chart
- 10 server-side alerts on price, indicators, or drawings
- No advertisements
- Regular customer support
Pro+ ($24.95 Per Month Paid Annually / $29.95 Per Month Paid Monthly)
- 4 charts per tab
- 2 devices at the same time
- 10 saved chart layouts
- Custom time intervals and range bars
- Intraday charts based on custom formulas (spreads)
- Intraday Renko, Kagi, Line Break, Point & Figure charts
- 12 customizable chart types
- 50+ smart drawing tools
- Compare symbols
- 100+ pre-built indicators, 8,000 community-powered indicators
- 10 indicators per chart
- 30 server-side alerts on price, indicators, or drawings
- No advertisements
- Priority customer support
Premium ($49.95 Per Month Paid Annually / $59.95 Per Month Paid Monthly)
- 8 charts per tab
- 5 devices at the same time
- Unlimited saved chart layouts
- Custom time intervals and range bars
- Second-based intervals
- Intraday charts based on custom formulas (spreads)
- intraday Renko, Kagi, Line Break, Point & Figure charts
- 12 customizable chart types
- 50+ smart drawing tools
- Compare symbols
- 100+ pre-built indicators, 8,000 community-powered indicators
- 25 indicators per chart
- 200 server-side alerts on price, indicators, or drawings
- No advertisements
- First priority customer support
- 30 day free trials are available for all plans.
There are no refunds for initial orders (first-time purchases) and there are no refunds for monthly plans. Refunds are available only after an automatic deduction for annual payments (say, after the trial period and after renewal) within 14 calendar days of payment.
TradingView accepts payment with all major credit cards and PayPal. You can also pay for annual plans via bitcoin.
About TradingView
TradingView is based in New York City with a secondary office in London, UK. The company was founded in 2011.
In 2013, TradingView added bitcoin charts to the platform, and the company has continued adding crypto charts to the platform over the years.
Final Word
TradingView is an HTML5-based charting platform that offers a wide range of charting tools, analysis features, and more. The platform is not only one of the most advanced charting platforms available today, but it’s also a thriving social network of traders. With over 8 million traders in the network, TradingView has something for everybody.
Overall, TradingView is ideal for intermediate to advanced traders who want to take their trading to the next level. It’s beginner-friendly enough for new traders but has enough advanced features to keep more experienced traders engaged.

I'm Aziz, a seasoned cryptocurrency trader who's really passionate about 2 things; #1) the awesome-revolutionary blockchain technology underlying crypto and #2) helping make bitcoin great ‘again'!
